Visualising larvae
Preparation of larvae
24 hours post fertilisation
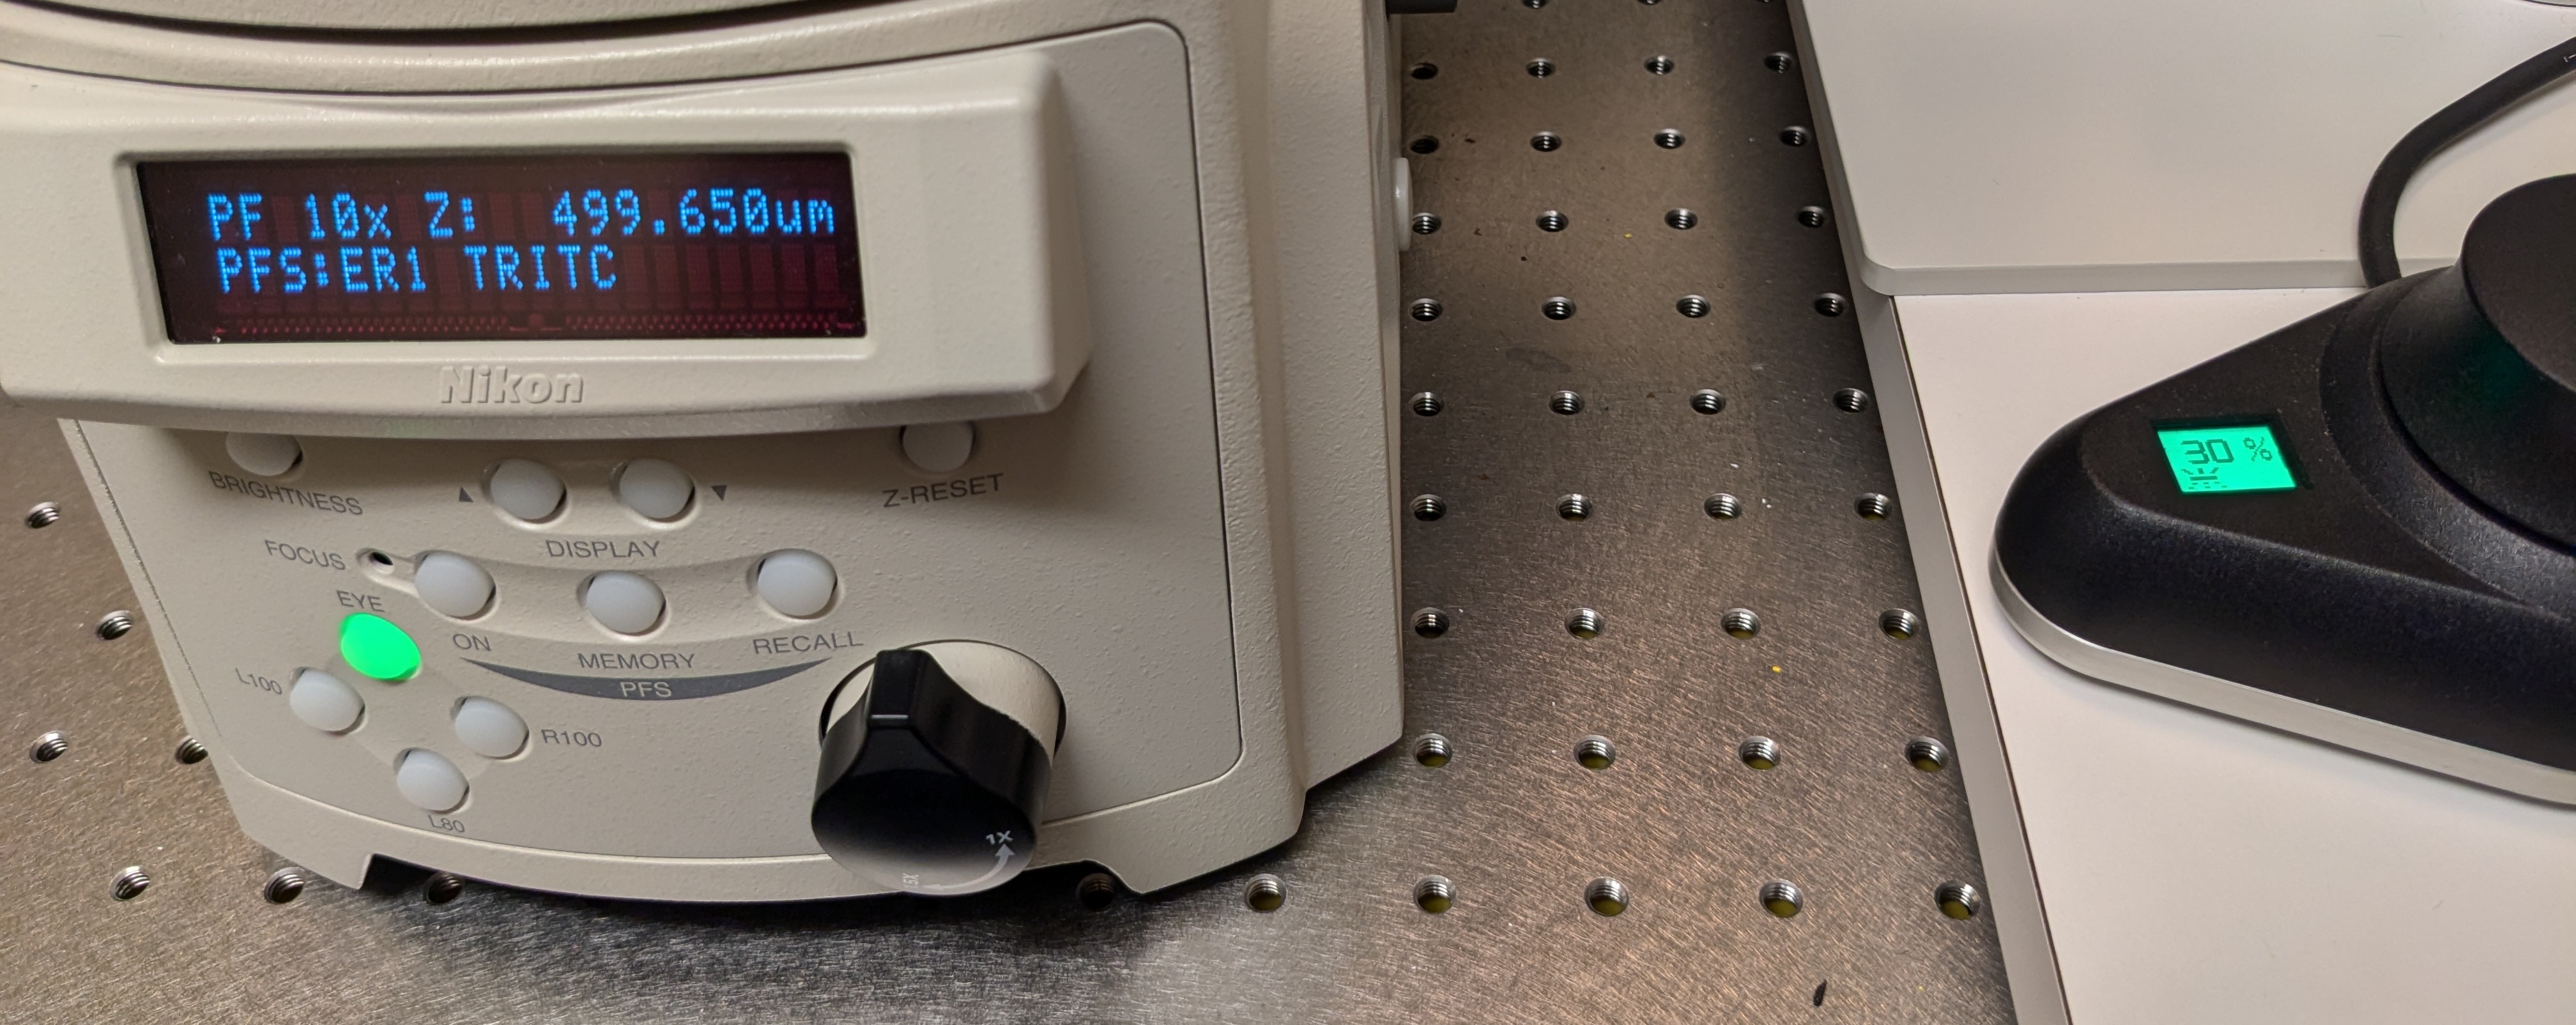
Developing purple sea urchin larvae don’t detach from the bottom of the petri dish in the first 24 hours post fertilisation, therefore it is possible to look at them as they are under the microscope. Take out the perti dish from the incubator, take off the lid and put it under the microscope. You can check to see if you have a good number of injected individuals by setting the microscope filter to TRITC and switching on the fluorescent light. Make sure to switch off the light in the room. Injected larvae will glow red.
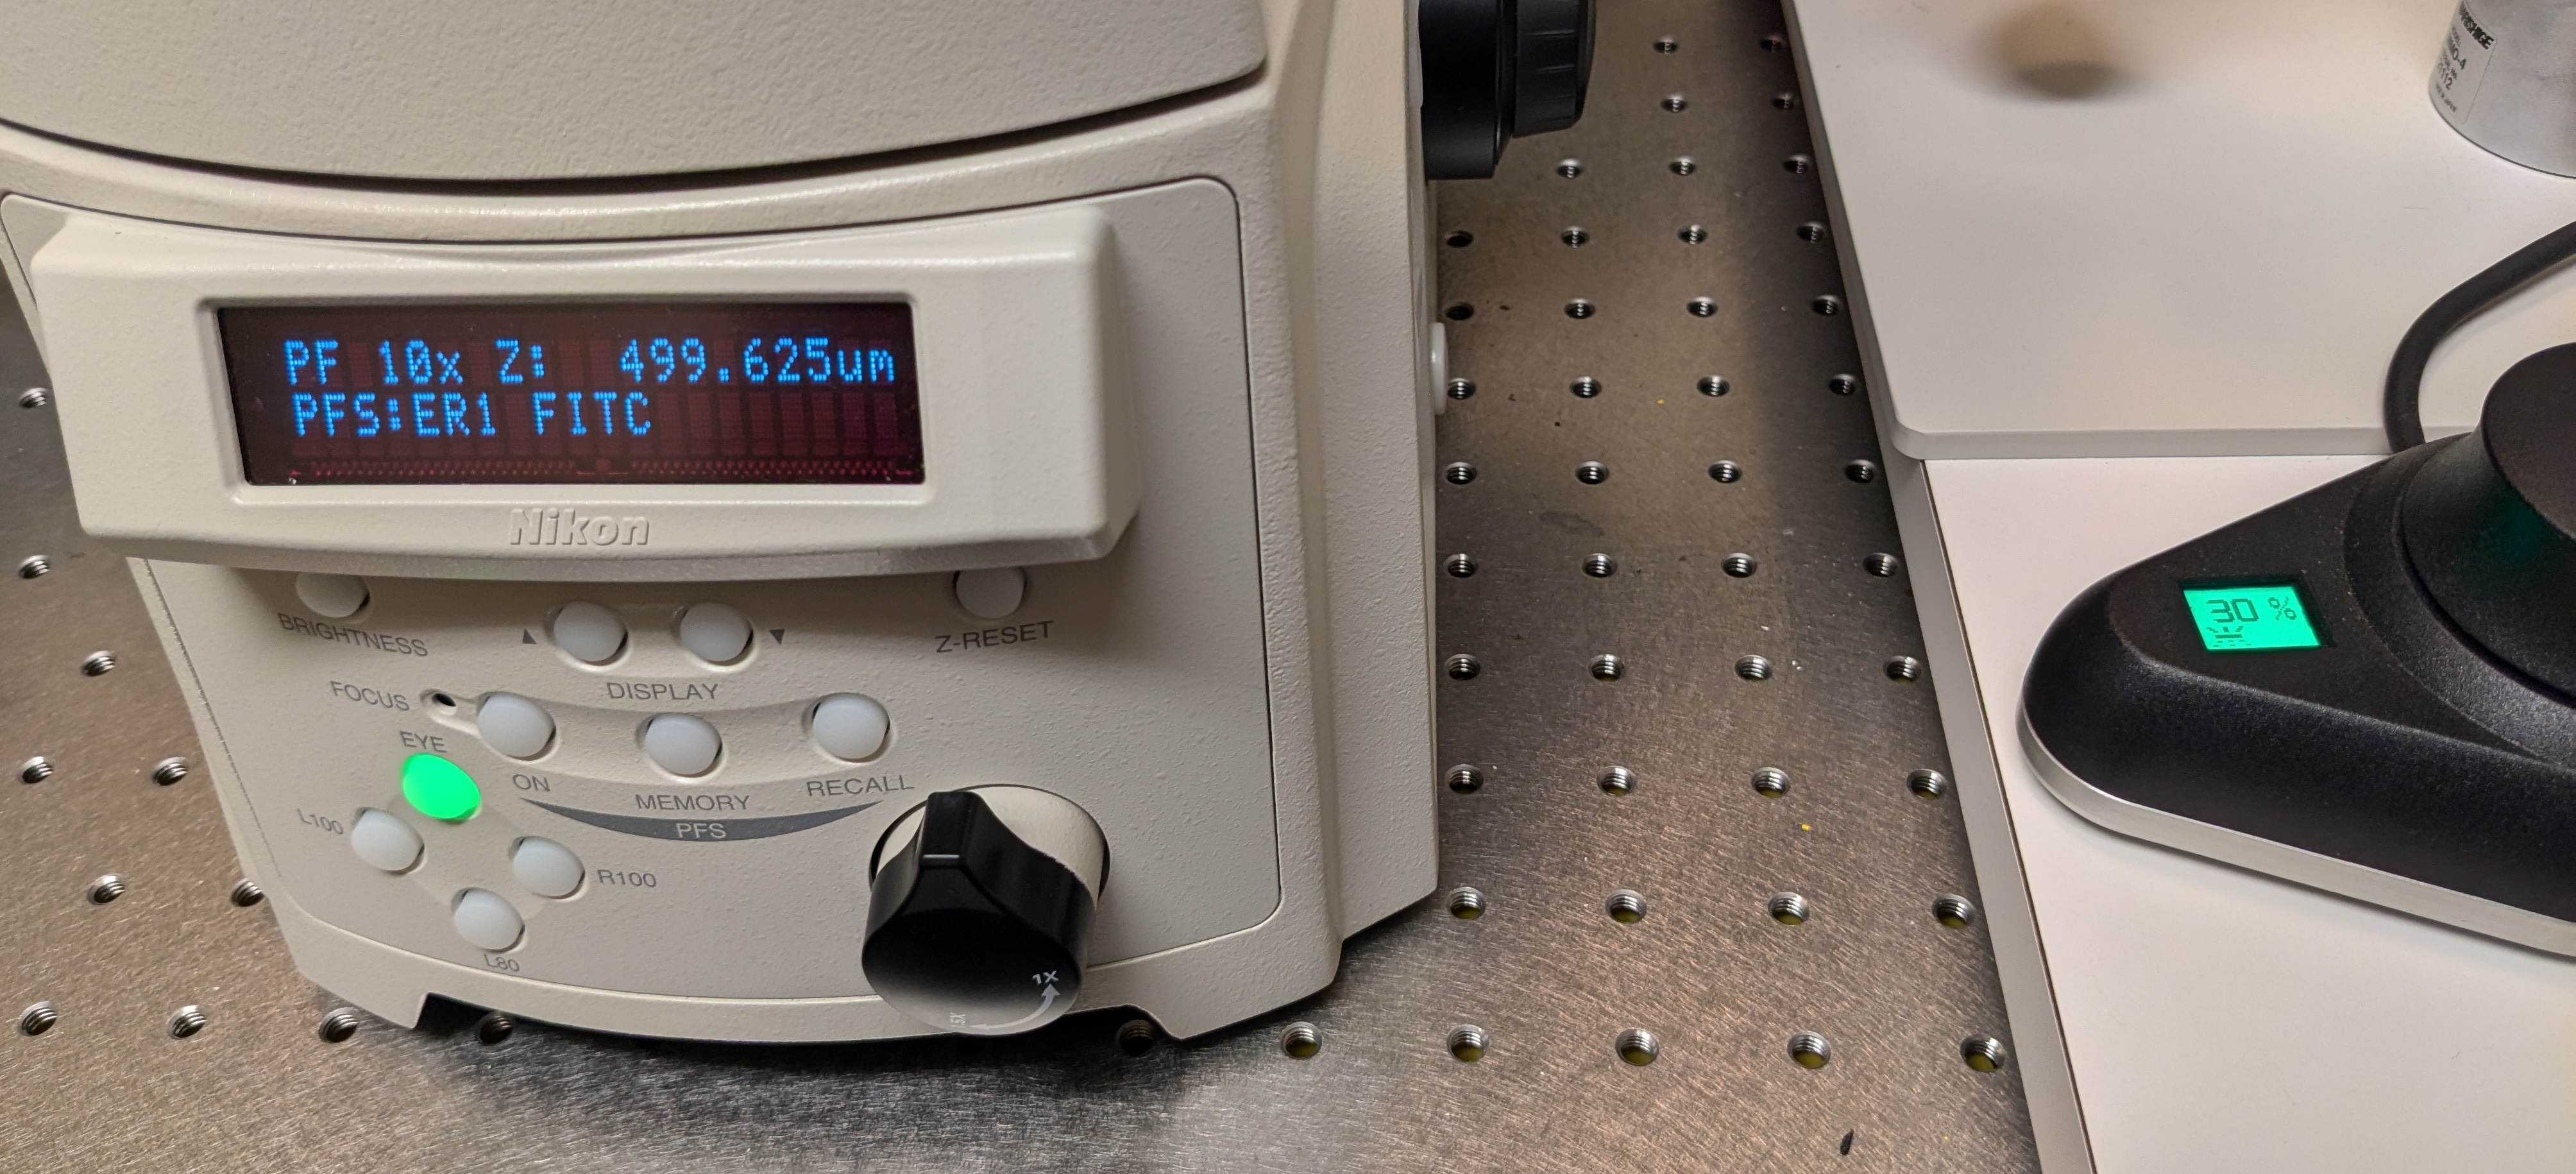
If your gene of interest is expressed highly before 24 hpf and you want to check for green fluorescence, you can set the filter to FITC and repeat above step. However, the signal could be too weak for you to detect with your naked eyes and you might need to use the computer with a higher intensity fluorescent light and more sensitive camera. You will also need to use the computer to quantifying the GFP signal. Additionally, because the plastic of the petri dish could mess with the fluorescence data, I recommend to follow the steps below for GFP detection even pre-24hpf.
24+ hours post fertilisation
After 24 hours the larvae detach from the bottom and can move around in the water column - first due to microcurrents, later due to the ability to actively swim around - which makes looking at them in the petri dish extremely frustrating. For any kind of signal detection (either control red or GFP), larvae need to be fixed in place.
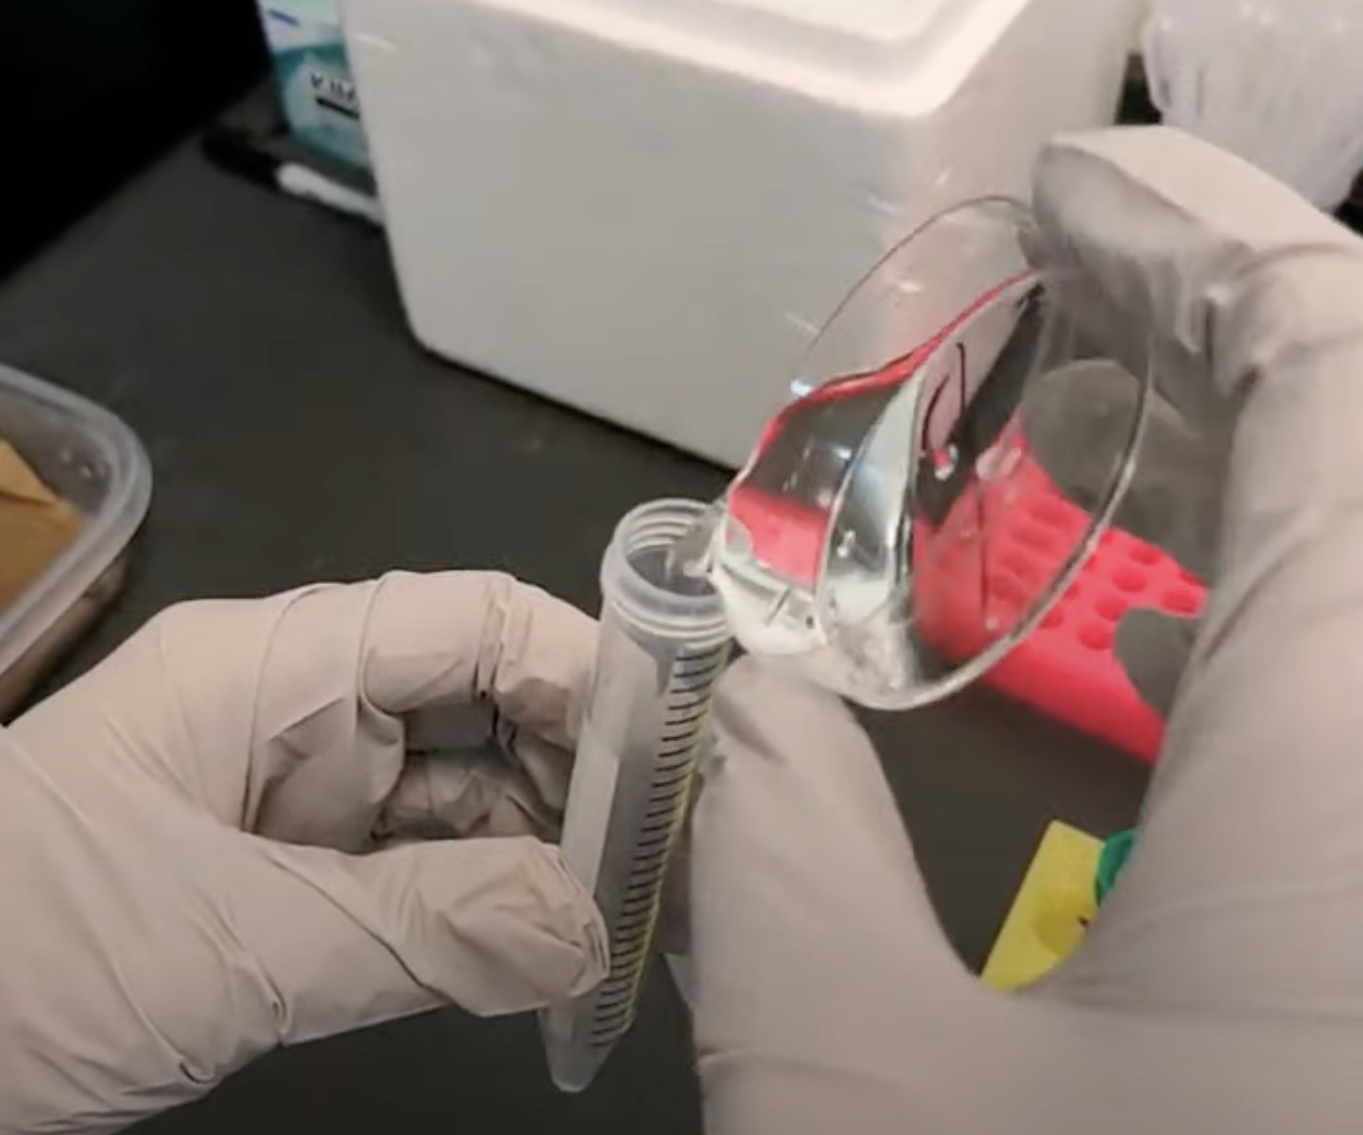
Step 1: Pour sea water from the petri dish into a 10ml falcon tube. Spin the tube in a centrifuge at 1000 rpm for 1 minute. The larvae should spin down to the bottom.
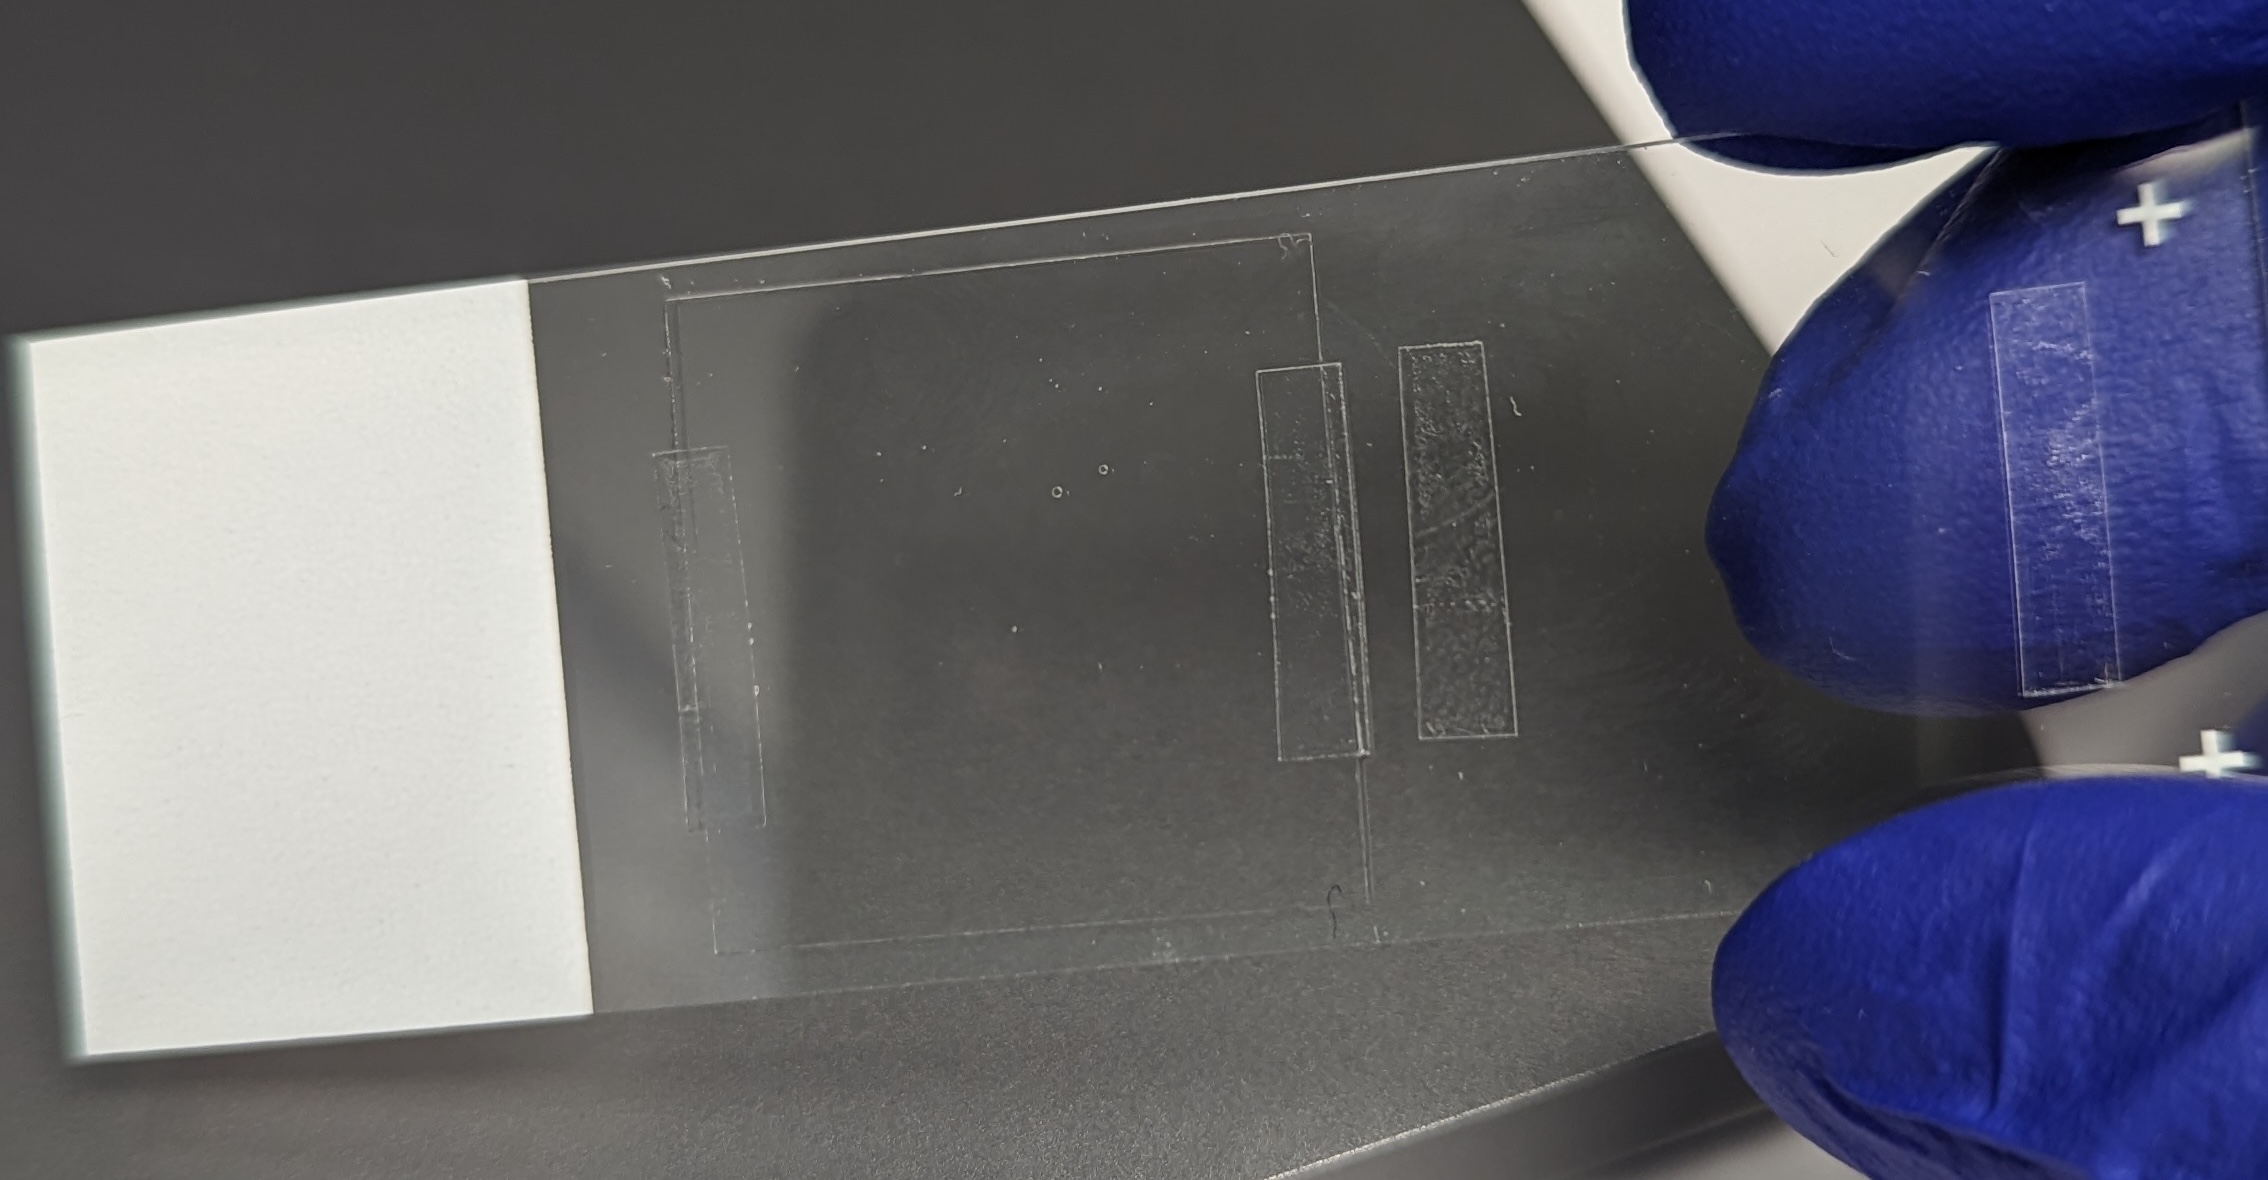
Step 2: Place two pieces of double-sided tape (3M Scotch 1/2 IN x 1296 IN) on a microscope slide. Pour off some of the sea water in the falcon tube to avoid submerging the pipette. Pipette ~30 ul from the bottom of the tube onto a microscope slide. Place a coverslip on the droplet of sea water. Press gently to make sure the coverslip sticks to the tape.
Since the sea water will dry up, you usually will have around 30-45 minutes to image the larvae, but that should be enough.
Preparation of the microscope
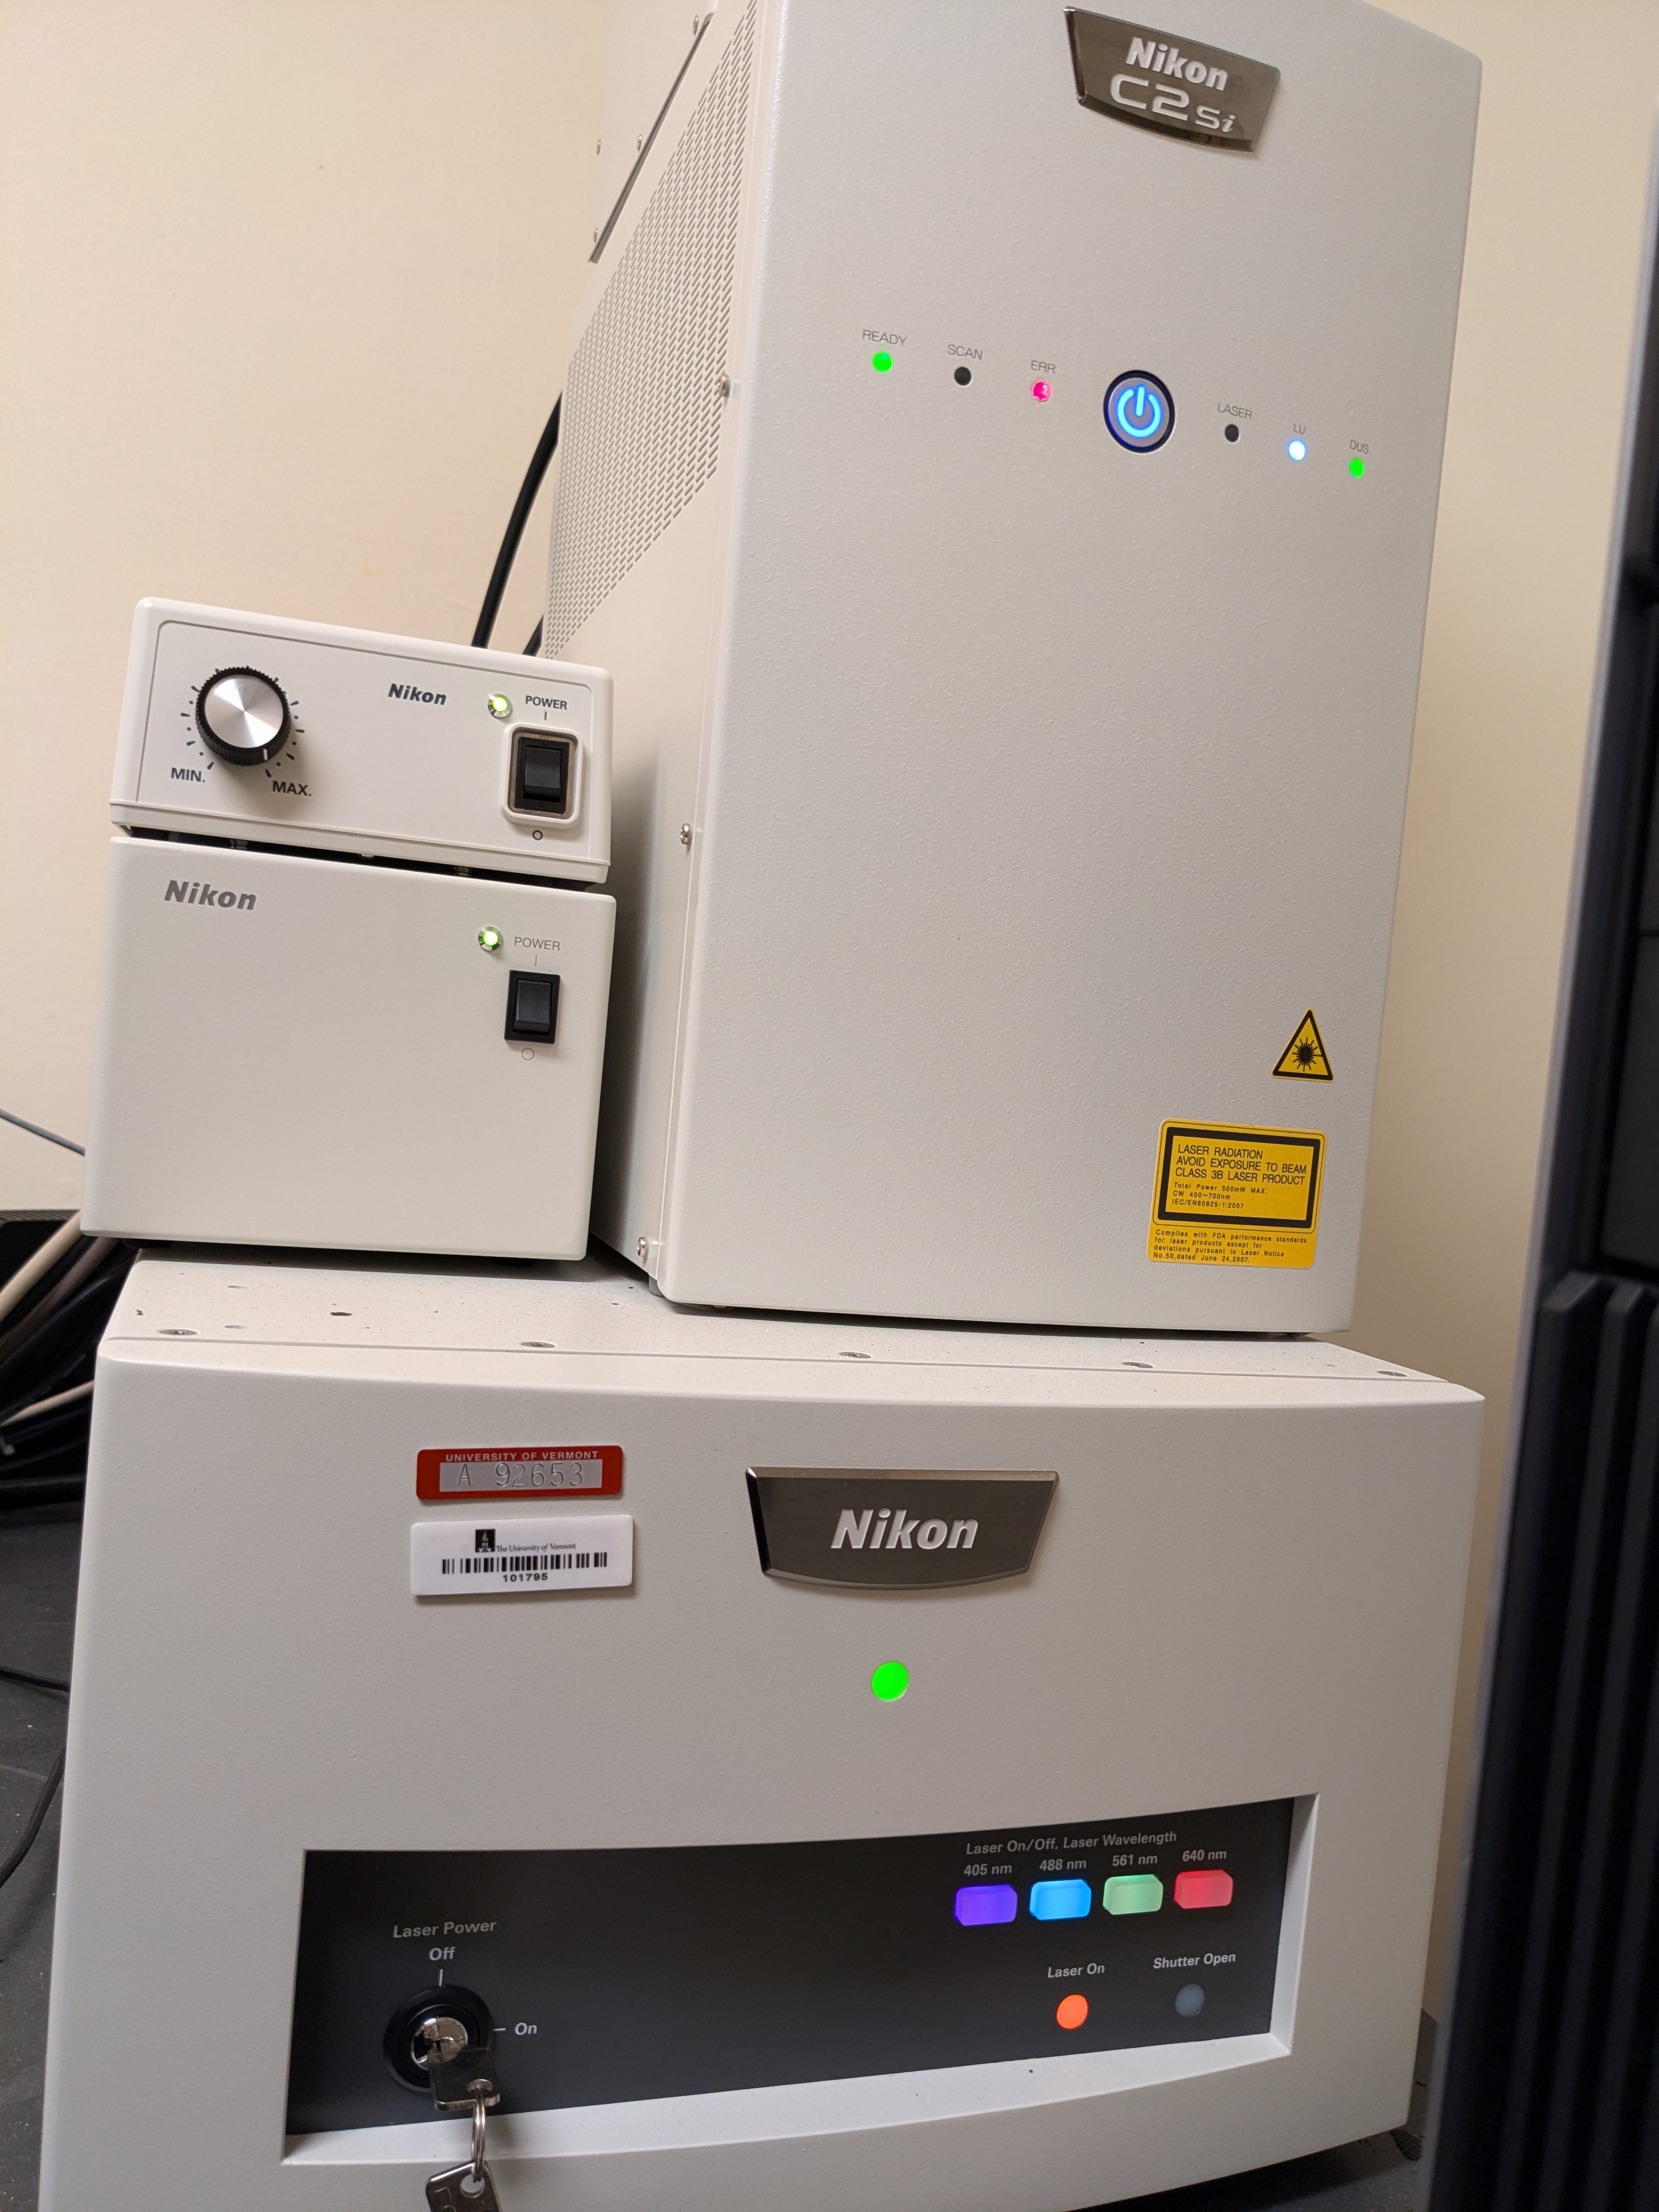
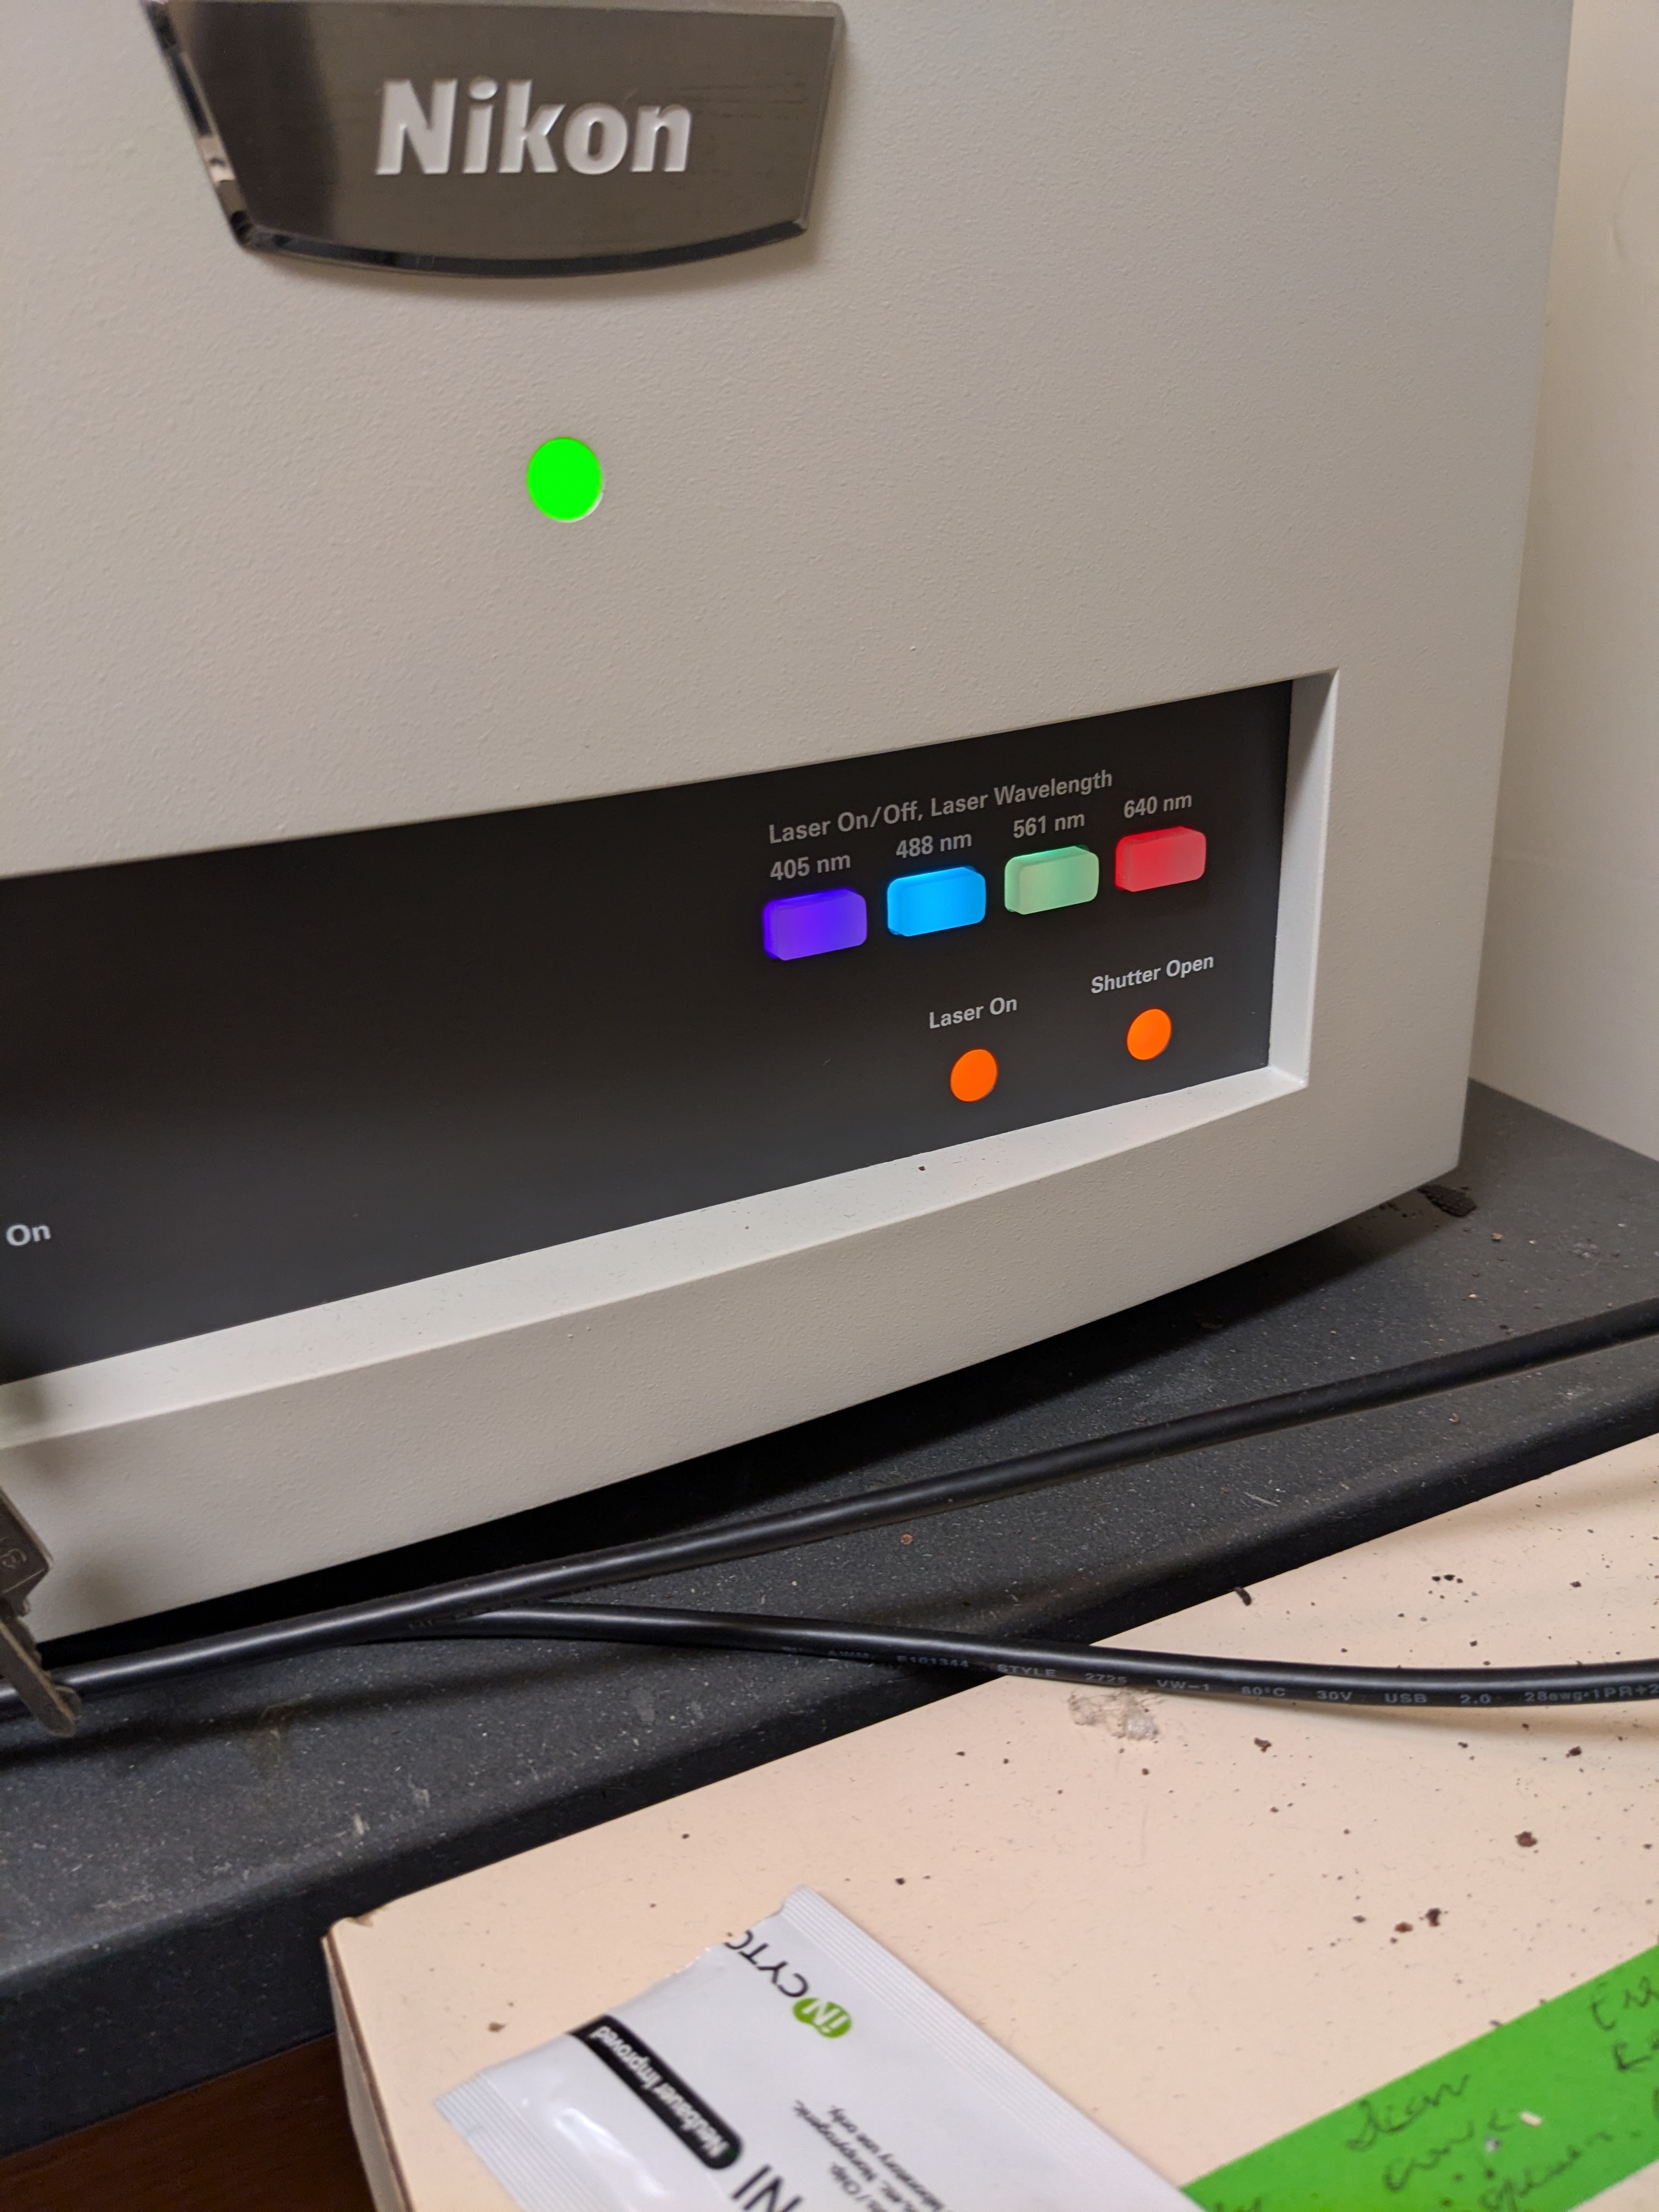
Step 1: Make sure to switch on the fluorescent light source first (big ON/OFF button and turning the key to the ON position under “Laser Power”), before opening the NIS-elements application on the computer. See image below. You will get an error message if you open the application first. (Once the application is open it might show a warning message about the OKO device, just hit cancel.)
Step 2: Place the microscope slide under the microscope, coverslip facing the objective (coverslip side down when using an inverted microscope).
NIS-elements application interface:
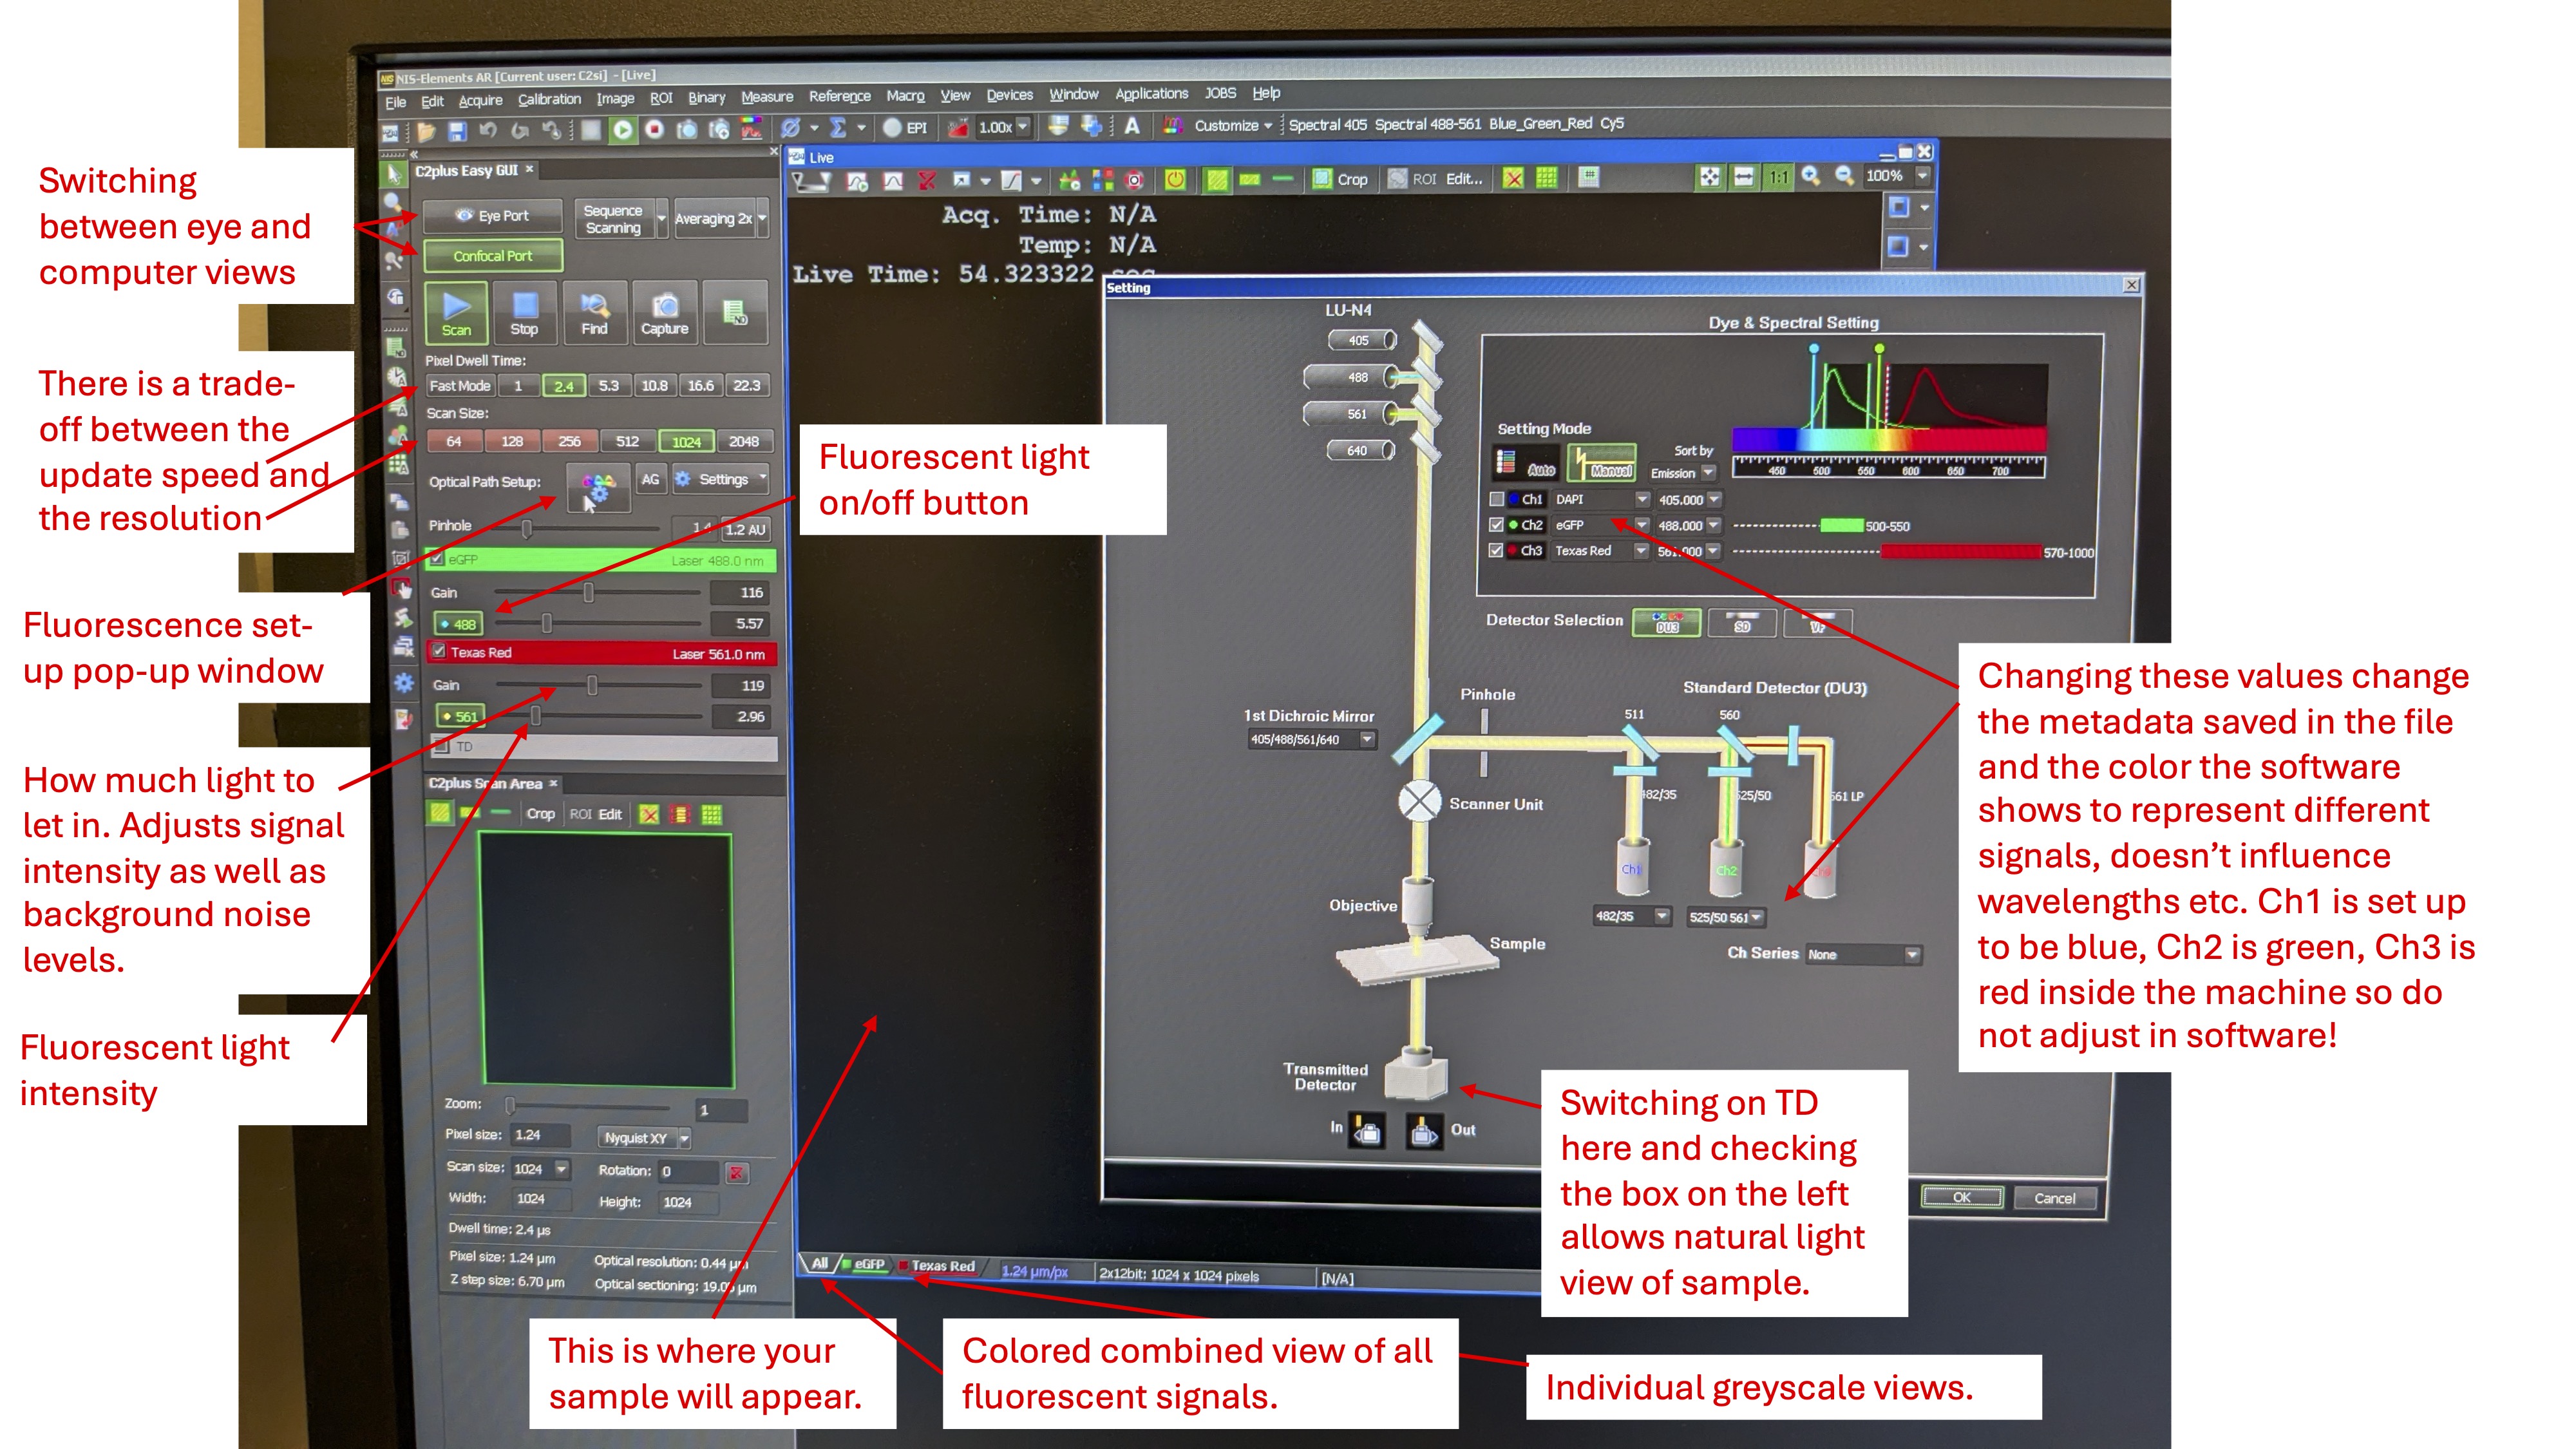
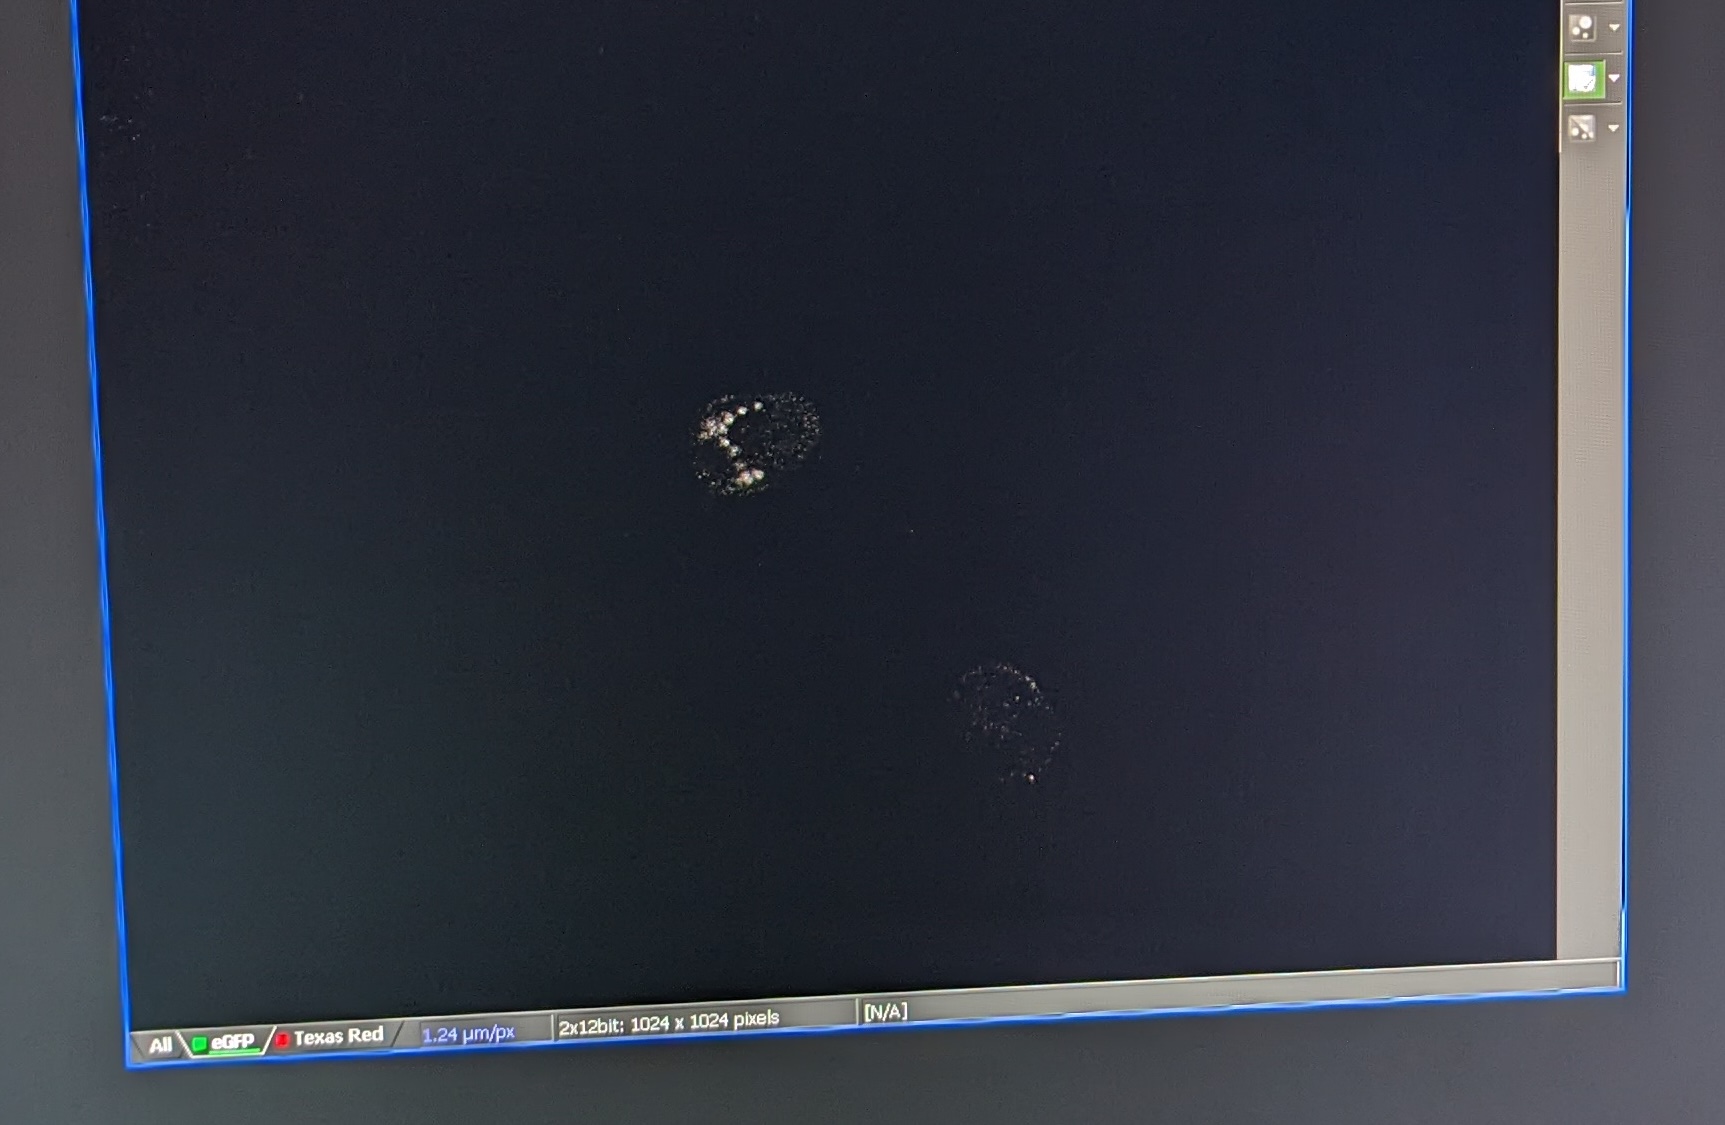
Step 3: Click on the Eye Port button and use the microscope eye port to locate and focus the larvae. Then, click on the Scan button to switch to the camera view. If the Remove Interlock button is red, it means that while the laser is on, but the shutter is in place (as indicated by the lack of light under the “Shutter Open” on the laser box). Click Remove Interlock to remove the shutter. You should see the laser hitting your sample under the microscope (if any of the lasers are selected and switched on in the left menu on the screen).
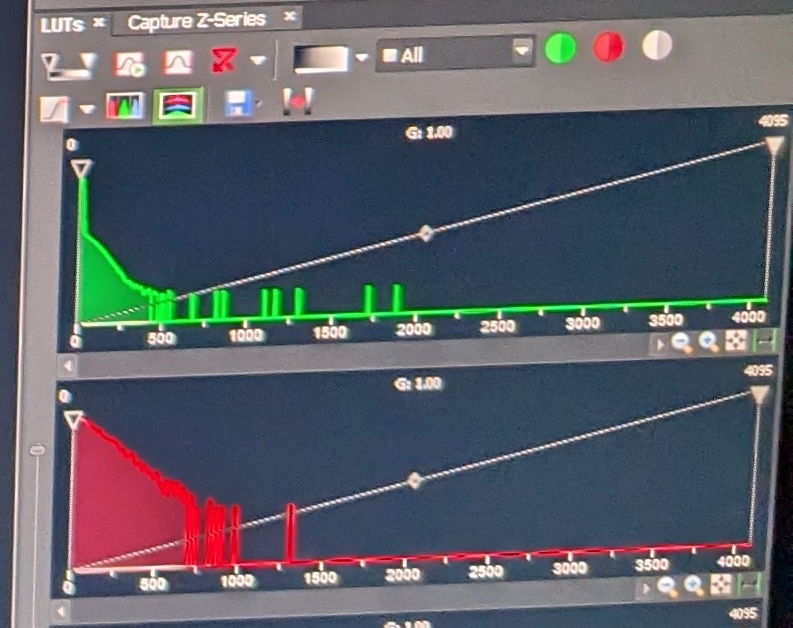
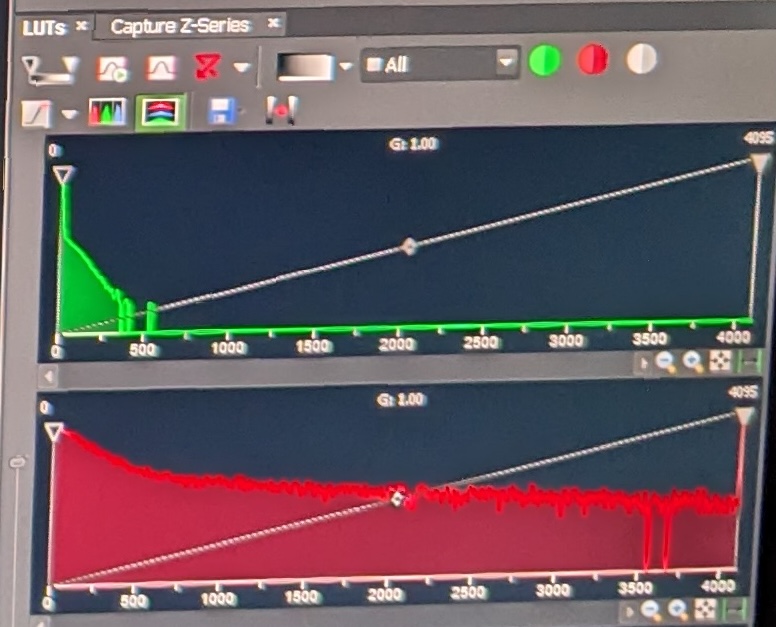
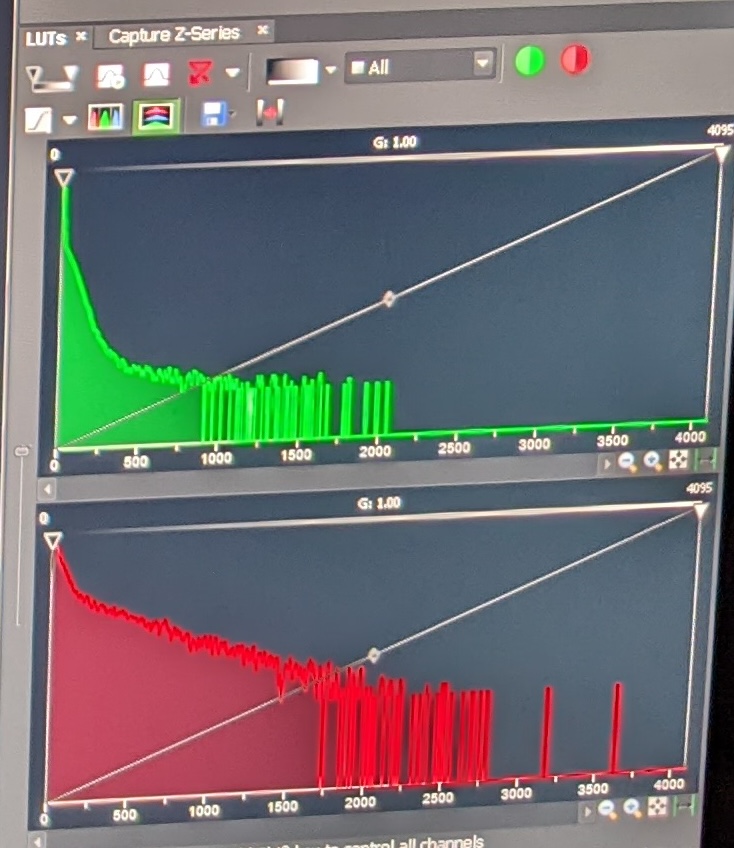
Step 4: Adjust the sliders for the different fluorescent signals such that the gain is as high as possible without the background of the sample being too noisy, and such that the distribution of pixel signal intensities is as below. Set the laser intensity low to avoid damaging the sample, but high enough for appropriate levels of excitation. In my experience, the following values will achieve this:
eGFP gain 115, laser intensity 10. Texas Red gain 120, laser intensity 2.
This is what the various pixel distributions should look like:
Step 5: Once you find a larvae with GFP expression, save the image (File -> Save). It will save the pixel values as well as the settings you used to take the image.
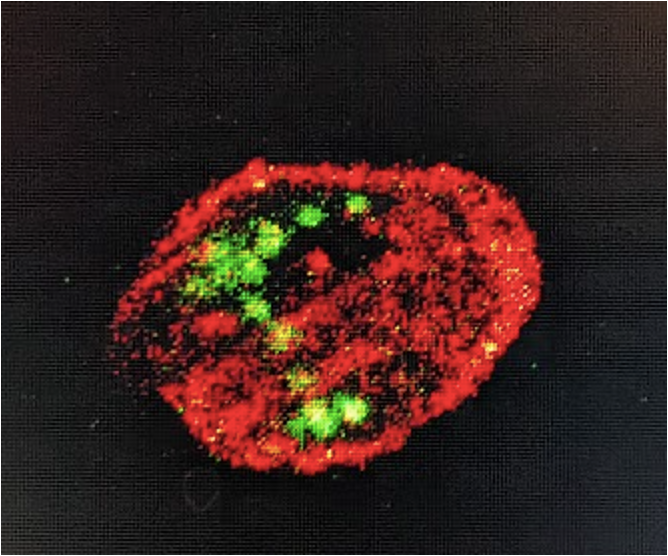
Example image of GFP expression:
Good luck! :)